


The mechanical properties of metals outline a metal’s behavior regarding external forces. These include the limits of its elasticity, when it will take a permanent set, how readily it will flow, and the tendency of the material to crack. Strength, stiffness, ductility, hardness and toughness answer different questions. Fatigue and creep address the effects of repeated loading and the passage of time.
Address the behavior that’s the most important to the function of the part. A bracket that springs back after bending needs a different check from a shaft that cracks after many revolutions.
Key mechanical properties of metals at a glance
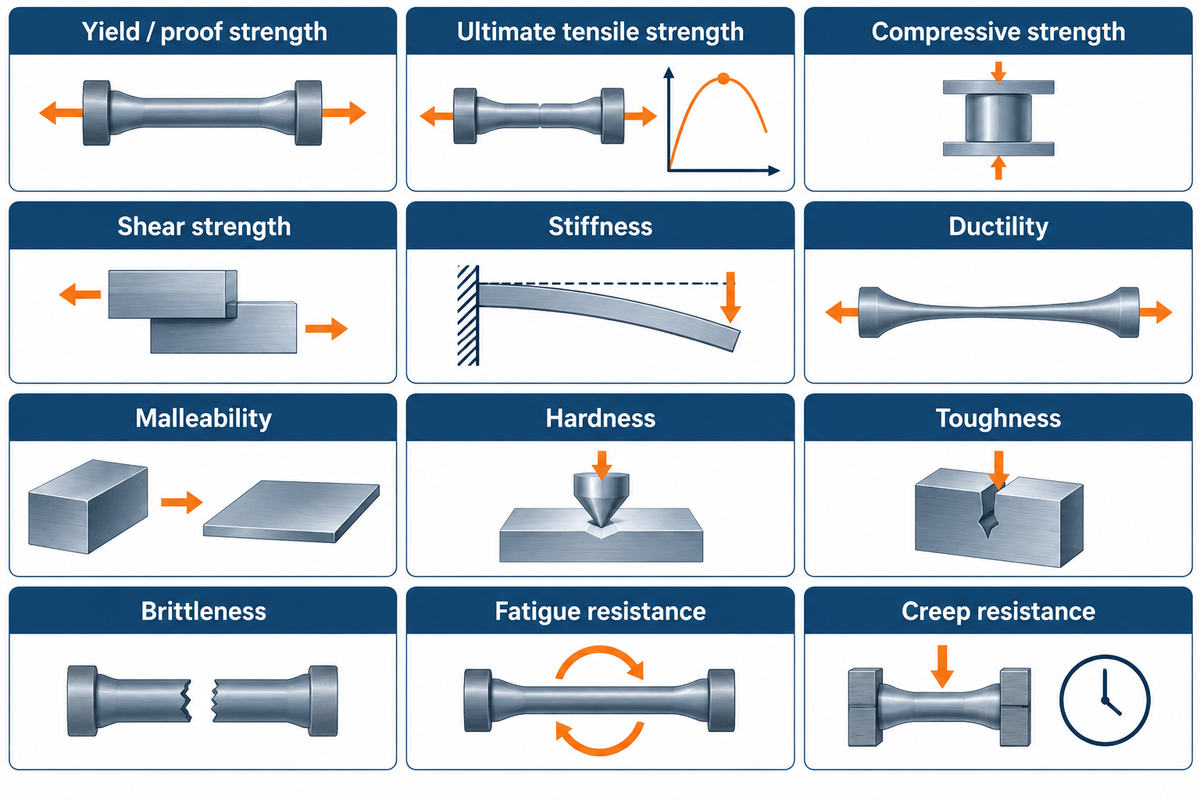
The fundamental mechanical properties define how a material resists deformation, develops permanent strain and fractures under stated loading conditions. The useful number may be a stress, a strain, an indentation result or absorbed energy. Determine that number before comparing metals. Large hardness numbers and large tensile strength numbers don’t measure the same response.
What are mechanical properties of metals?
Mechanical properties are measurable characteristics of a metal’s behavior when it’s subjected to stress. These characteristics include strength, stiffness, ductility, hardness and toughness, and also the behavior of material as a result of fatigue and creep. Mechanical tests apply controlled loads and measure deformation or failure; the result belongs to the material condition and testing conditions used.
The following 12-entry reference breaks down commonly associated properties. Elastic deformation is recoverable; plasticity means the capacity for permanent deformation, allowing metals to be formed. Those two behaviors run through several rows rather than requiring a separate test number in every list.
| Property | What it describes | Typical report quantity | Useful question |
|---|---|---|---|
| Yield or proof strength | Onset of defined permanent strain | Stress, MPa | Will the part take a permanent set? |
| Ultimate tensile strength | Maximum engineering tensile stress | Stress, MPa | What peak stress did the tensile specimen carry? |
| Compressive strength | Response under squeezing loads | Stress, MPa, with strain and geometry | Will it crush or yield in compression? |
| Shear strength | Resistance to sliding across a plane | Stress, MPa | How does it respond in a shear test? |
| Stiffness | Resistance to elastic strain | Young’s modulus, GPa | How much will it stretch elastically? |
| Ductility | Plastic extension before fracture | Elongation or reduction in area, % | How much tensile forming can it accommodate? |
| Malleability | Plastic shaping under compression | Process-specific forming assessment | Can the material be pressed or rolled into shape? |
| Hardness | Localized resistance to indentation | Named scale, such as HBW, HRC or HV | How does the surface resist the specified indenter? |
| Toughness | Energy absorption or crack resistance, according to test | Charpy energy, J; fracture toughness, MPa√m | Does the test represent an impact or a sharp crack? |
| Brittleness | Fracture with little plastic strain | Fracture behavior at stated conditions | How much permanent deformation precedes fracture? |
| Fatigue resistance | Response to cyclic loading | Stress amplitude and cycles, with load ratio | How does it perform under repeated loading? |
| Creep resistance | Resistance to time-dependent strain | Strain versus time at stress and temperature | Will sustained loading cause gradual deformation? |
Physical properties include density, melting range, and thermal conductivity. Corrosion resistance is concerned with the interaction of the matter with the environment; machinability is concerned with the behavior of the matter with a manufacturing process. All matter to material selection, but none can replace a measurement of mechanical response. Penn State’s mechanical-properties lesson provides the underlying stress, strain and deformation distinctions.
Strength: yield, tensile, compression and shear
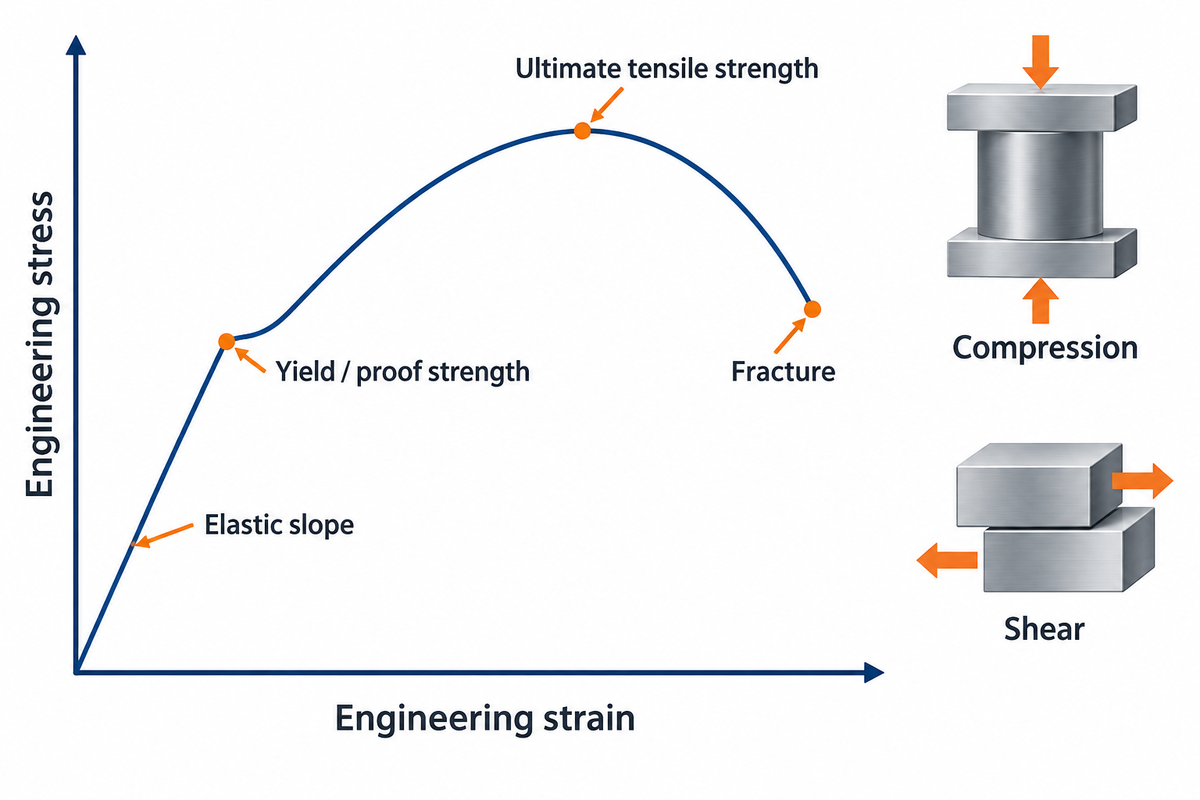
Strength of a metal is the maximum stress it can withstand prior to yielding or failure. Yield strength concerns permanent deformation; ultimate tensile strength is the peak engineering stress in a tensile test. Compression and shear need their own loading definitions rather than a tensile number relabeled for another purpose.
Stress and strain can each be defined in different ways. Engineering stress is force divided by the specimen’s original cross-sectional area. Engineering strain is defined as the change in gauge length divided by its original length. Stress is commonly expressed in MPa, while strain is expressed as a fraction or percent. The position of elastic response, yield point, strain hardening, and fracture on the stress-strain curve illustrates their respective positions.
Some metals have a defined yield region. For others, a proof-strength convention locates a specified offset from the elastic line. A proof strain of 0.2% is equivalent to 0.002 on the strain axis. The reported yield stress is a defined comparison point; it isn’t the breaking stress. Mississippi State’s strength and stiffness teaching material shows the yield point and the proportional limit.
After yielding, many ductile metals can carry increasingly heavier loads as they strain harden. Once necking starts, the shrinking local section matters. Ultimate engineering stress uses the original area, while true stress uses the instantaneous area. Therefore, a peak on the engineering curve doesn’t mean fracture occurs at that exact point.
Compression adds a geometric complication. For a metal that does not fail by shattering, a reported compressive-strength value depends on the strain reached and the specimen geometry. A slender sample may buckle; friction at the ends can cause it to barrel. The public significance section of ASTM E9-19 (2025)e1 provides these types of considerations. Do not assume that a compression value and a tensile value represent matching failure events.
Shear tests load the material so adjacent regions tend to slide. A pin, joint or torsion loaded shaft also involves a combination of geometry and a true stress distribution. A shear strength result aids in characterizing the material; it doesn’t give the load rating of the joint. Name the test, loading direction and failure criterion alongside the number.
Stiffness and elasticity: how much will a metal deform?
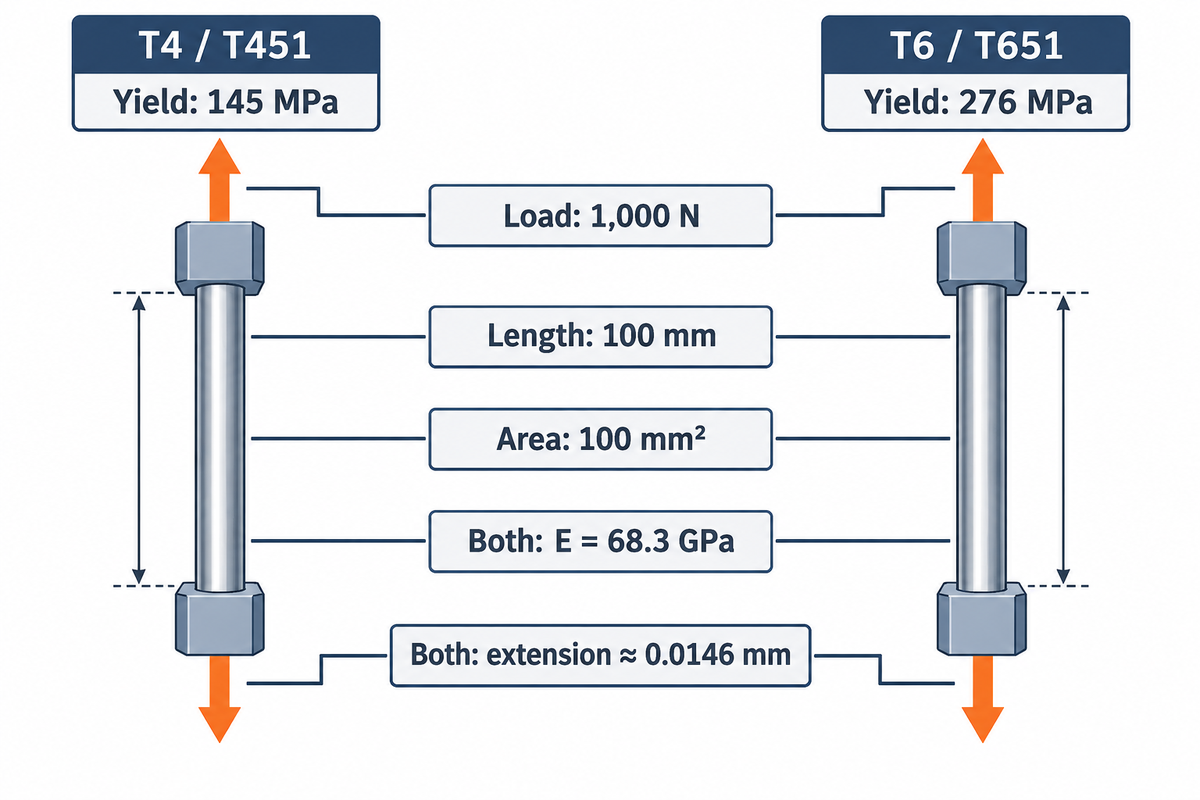
In the equal-bar illustration, a 1,000 N axial load gives about 0.0146 mm extension for either 100 mm long, 100 mm² bar using E = 68.3 GPa. Stiffness controls elastic movement; a higher yield strength delays permanent strain without proportionately increasing the elastic slope. Young’s modulus is also called the modulus of elasticity.
Material stiffness and component stiffness are related but different. The latter also includes length, section shape and support conditions. A hook may resist large forces without breaking yet deflect too much to hold alignment. Increasing section depth may substantially change the bending response while keeping the alloy the same.
Same alloy, different strength: a worked example
Kaiser Aluminum’s 6061 rod-and-bar datasheet lists the following typical values. These aren’t specified acceptance limits or results from a Zhenling production lot.
| Condition | Yield strength | Ultimate tensile strength | Elongation, 4D | Brinell, 500 kgf load / 10 mm ball | Elastic modulus |
|---|---|---|---|---|---|
| T4 / T451 | 145 MPa | 241 MPa | 25% | 65 | 68.3 GPa |
| T6 / T651 | 276 MPa | 310 MPa | 17% | 95 | 68.3 GPa |
Consider two uniform straight bars, one in each listed condition, each 100 mm long with a 100 mm² cross-sectional area. Assume a centered axial tensile force of 1,000 N, room-temperature linear elastic response, and negligible compliance from grips or joints. The stress is 1,000 N ÷ 100 mm² = 10 MPa. Using the listed modulus of 68.3 GPa, or 68,300 N/mm², both bars have the same calculated extension. Their different yield values matter when checking the onset of permanent strain; they don’t multiply the elastic slope. The example isolates the material response at equal geometry and loading. It isn’t a prediction for a bending bracket, a threaded assembly or a certified working load.
Elastic extension = force × length ÷ (area × modulus).
Extension = (1,000 N × 100 mm) ÷ (100 mm² × 68,300 N/mm²) ≈ 0.0146 mm for either bar.
Modulus reports also require a measurement basis. “ASTM E111-17(2025)e1” identifies Young’s, tangent, and chord modulus, and states the importance of stress mode, strain history, alignment, temperature, and strain measurement. A tension result and a compression result are not automatically interchangeable.
Too much recoverable movement
- Compare elastic modulus.
- Review section shape and length.
- Check supports and joint compliance.
Permanent set after unloading
- Compare yield or proof strength.
- Review the actual stress distribution.
- Check grade and supplied condition.
Ductility, malleability and brittleness in forming
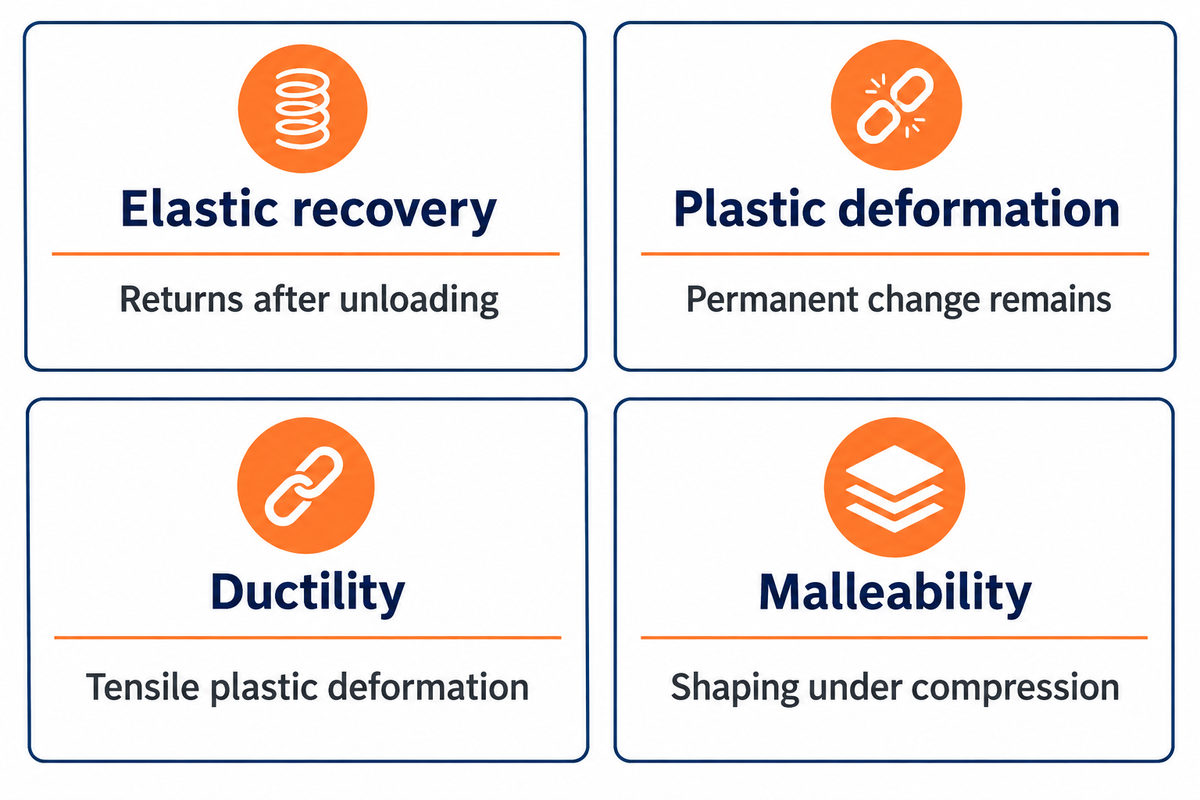
Ductility describes tensile plastic deformation before fracture, while malleability concerns shaping under compressive forces. Brittle materials fracture with little plastic deformation under the conditions of interest. A material may be strong, but it may not offer much forming strain; therefore, strength doesn’t always describe how far a workpiece can be formed.
Elongation percentage means the resulting elongation after fracture compared to the original gauge length. Percentage reduction in area is the decrease from the original cross-sectional area to the minimum area after fracture, divided by the original area and multiplied by 100. Both describe the ductile response, but measure different changes. A long gauge length and a short one don’t always yield interchangeable elongation percentages.
The public scope of “ASTM E8/E8M-25” makes this issue clearer. Most round E8 specimens have a gauge length of 4D, while E8M has 5D, where D is the specimen diameter.
“The gauge lengths for most round specimens are required to be 4D for E8 and 5D for E8M.”
Forming processes introduce another distinction: a tensile elongation value doesn’t describe every strain path. Deep drawing, rolling and bending place different demands on the material. The Fabricator’s Die Basics discussion of metal behavior connects elastic recovery, plastic strain and forming characteristics.
After unloading, elastic recovery produces springback; plastic strain remains. A metal’s ability to return to its original shape therefore describes elasticity, not unlimited formability. For parts prone to cracking and with little visible strain, the separate guide to brittleness explains fracture behavior in more detail.
Hardness testing and toughness: surface versus fracture
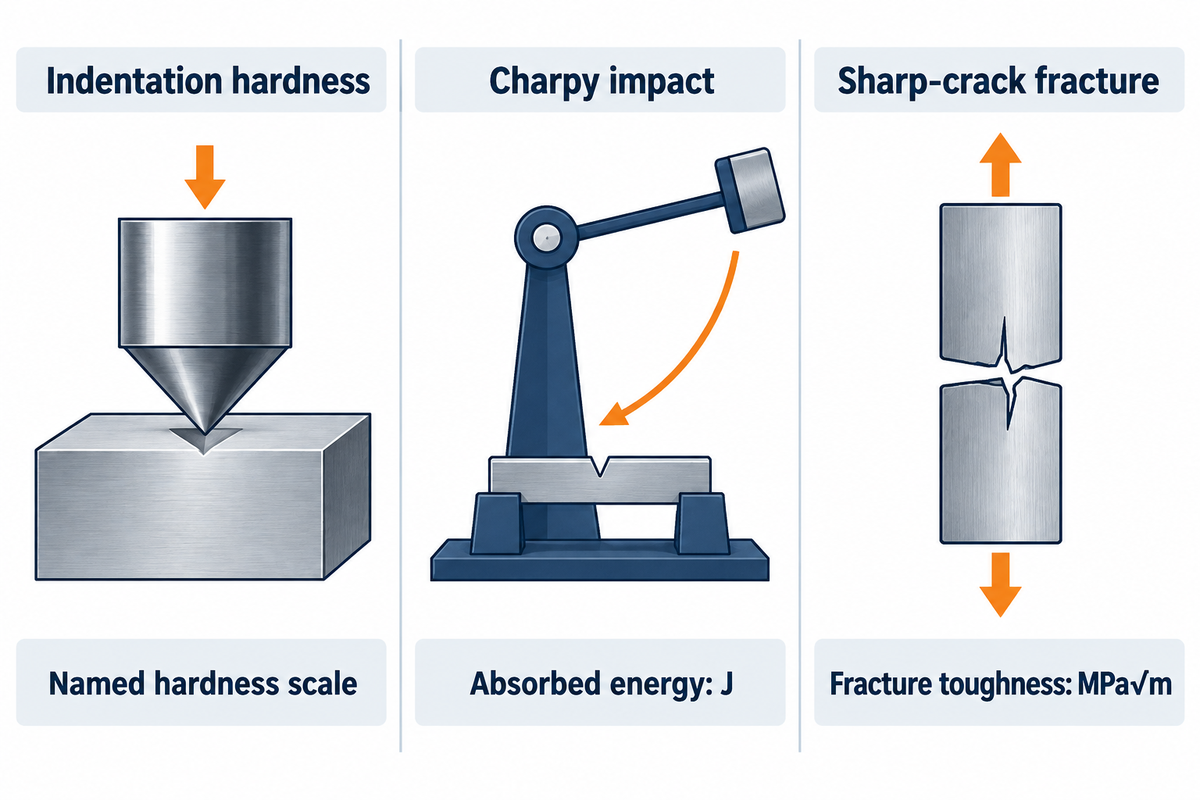
Hardness testing measures the response to localized indentation, and toughness measures ability to absorb energy or resist crack growth. Hardened steel can resist an indenter but still be vulnerable to a sharp crack. Impact tests and fracture-toughness tests also differ from each other, so the word toughness needs a named test before two results can be compared.
For indentation testing, hardness is defined by the response to a particular indenter and loading procedure. Rockwell hardness uses indentation depth, Brinell uses an indentation measurement with a ball, and Vickers uses a diamond pyramid. The hardness testing methods produce different scales; a bare number without its scale is incomplete. The metal hardness reference explains the details of the tests.
Higher hardness can be useful for preliminary assessment of wear resistance; however, wear also depends on the contacting materials, load, lubrication, and environment. A hardness-to-strength relationship is valid only within its validated material and condition range. It does not reveal tensile elongation, the entire stress-strain response or crack resistance.
A Charpy test strikes a notched specimen with a pendulum and measures absorbed energy, commonly reported in joules. The Izod test uses a different specimen support arrangement. ASTM E23-25 covers both notched-bar methods; NIST’s Charpy explanation shows how the pendulum measurement works. Specimen size, notch, orientation and temperature belong with the result.
Plane-strain fracture toughness, KIc, describes resistance in the presence of a sharp crack under specified linear-elastic, high-constraint conditions. Its stress-intensity units, such as MPa√m, are different from impact energy. ASTM E399-24 requires validity criteria and excludes cleavage-fracture testing from its intended scope. A Charpy value cannot be substituted for KIc in a crack calculation.
A Charpy or Izod test method should be used for a requirement for absorbed-impact energy. For a sharp-crack assessment, the appropriate fracture-toughness method should be used. Measuring the energy absorbed in a pendulum test doesn’t give a universal allowance for a sharp crack of a given size.
Fatigue, creep and impact resistance under service loads
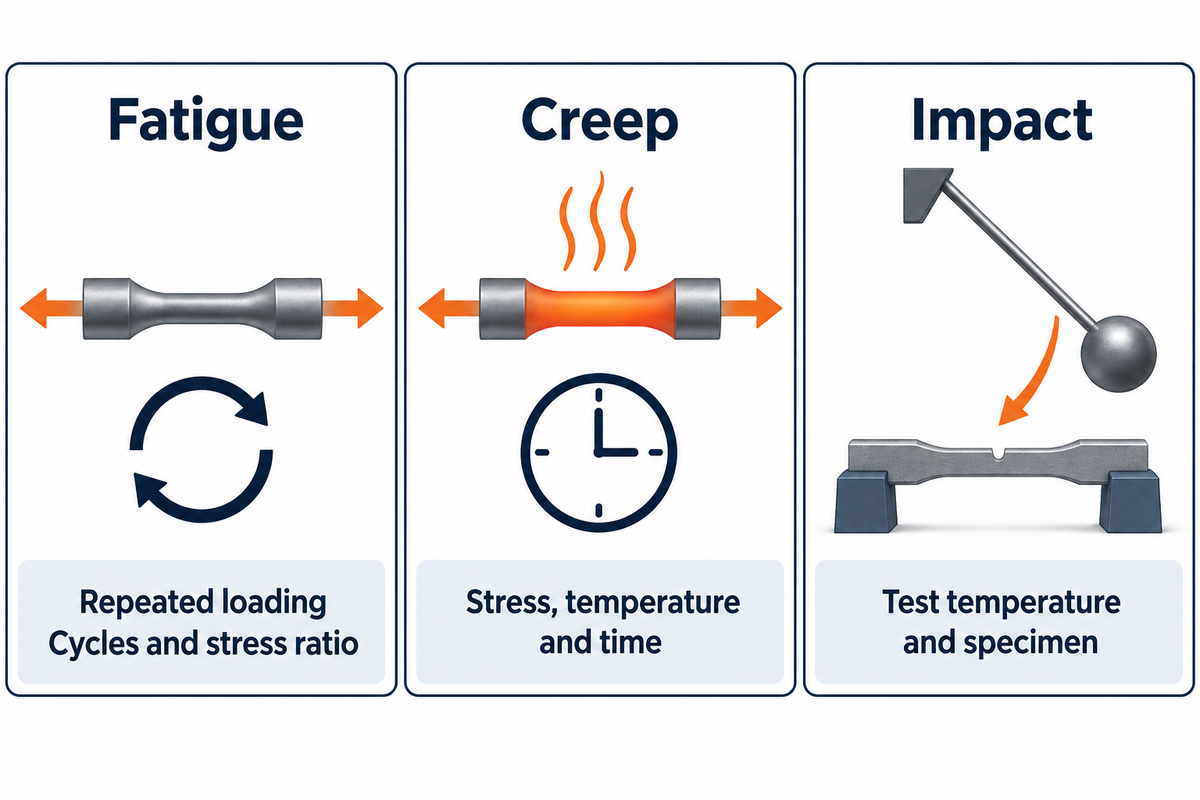
For evaluation of fatigue resistance, repeated loading and unloading, the condition of the material at the beginning of the test and the environmental conditions need to be addressed. Impact resistance addresses a rapid loading event. These properties require loading history, temperature and test conditions that room-temperature tensile properties alone cannot supply, even when tensile strength is high.
Fatigue cracks can grow under cyclic nominal stresses below the yield strength. Surface marks, notches, section changes and residual stresses affect local behavior. An assessment of stress-life requires specification of the number of cycles and the relationship between minimum and maximum stress. The University of Portland fatigue teaching excerpt demonstrates why assessments of endurance of specimens and actual machine components can be different.
Consider a shaft with a shoulder adjacent to a bearing. A material table shows ample static strength, but the shoulder sees bending stress on each revolution. Improving the nominal tensile value leaves the shoulder geometry, tool marks and load history unresolved. Compare fatigue data for the mode of loading that applies, account for the location of the highest local stress, and consider the surface finish. Where corrosion is possible, don’t read a shaft endurance result as infinite life: the Encyclopedia of Physical Science and Technology notes that corrosion greatly accelerates fatigue and that with corrosion present there is no endurance limit. The useful screening question changes from how much load the metal can withstand once to how the finished section responds over the required duty.
Treat a catalogue endurance figure as a specimen value: for steel below 1400 MPa tensile strength, Shigley’s textbook estimate is 0.5 times tensile strength for a rotating test specimen, before surface finish, size, loading and temperature factors are applied for the real part. E399 states that cyclic forces can propagate a crack at stress-intensity levels below KIc.
Creep is a separate time-dependent deformation process under sustained stress. ASTM E139-24 covers deformation versus time and time to rupture under constant tensile force and temperature. A creep comparison must name stress, temperature, duration and the strain or rupture criterion. A short tensile test cannot describe all of those variables.
In the case of an impact requirement, the Charpy or Izod test temperature and the specimen details must also be included. Impact strength is frequently used loosely and a statement of the actual quantity and method must be included for a purchase requirement. Nickel alloys, steels and aluminum alloys need service data in specific conditions to support their choice rather than their general reputation of being strong.
Heat treatment and manufacturing change material properties
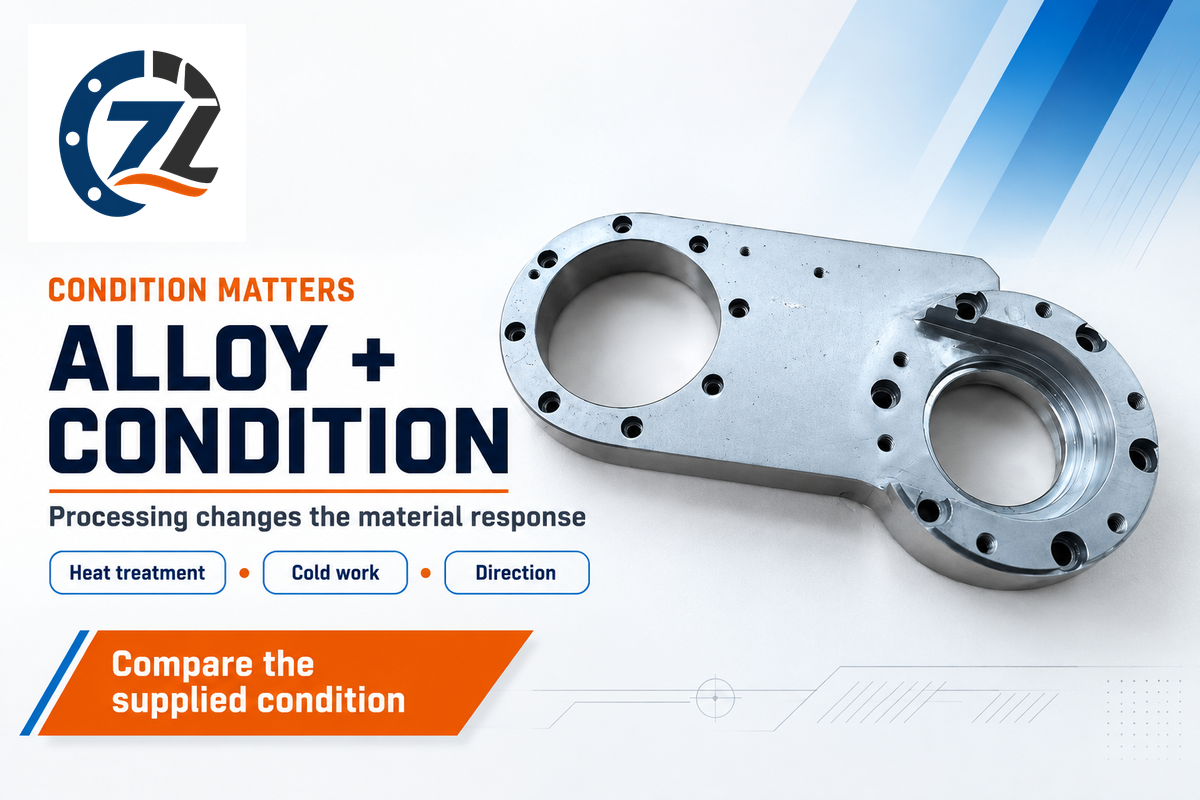
Heat treatment, cold working and manufacturing route can change the metal’s microstructure and the measured mechanical properties. The direction and extent of the change depend on the alloy and the treatment condition: a treatment can soften one material, while hardening another. One alloy can carry very different mechanical properties: the 6061 table above lists a typical yield strength of 145 MPa in T4 / T451 and 276 MPa in T6 / T651, so state the condition with the alloy designation.
Quenching and tempering are relevant to hardenable steels; precipitation aging applies to suitable alloys, including the 6061 conditions compared earlier. Annealing and cold work take different routes. Hardness and ductility often change together with strength, but a gain in one property can cost another: in the 6061 comparison earlier, typical elongation falls from 25% in T4 to 17% in T6 while yield strength rises.
The University of Ljubljana’s ESDEP steel-properties lecture points out that there are certain properties that are relatively insensitive to microstructure, such as elastic modulus. Strength and ductility, on the other hand, are more structure-sensitive. That’s why a stronger condition can retain a similar elastic slope.
The 2020 microstructure research exhibit at Penn State discusses pre-strain, rolling direction and phase-fraction effects on modulus. For springback prediction or a close modulus comparison, measured condition and direction matter; never changes is too broad a rule.
During manufacturing, direction can be important too. A 2021 NIST review on laser powder bed fusion demonstrated how anisotropy in properties can be related to texture, microstructure, and defects.
Mechanical property data: compare suppliers on the same basis

Mechanical property data become comparable when alloy, condition, product form, test basis, and reporting purpose match. A typical catalogue value describes a published reference condition; a specified minimum defines an agreed requirement; a lot result records an identified sample. Ranking those three numbers as though they were equivalent can reverse a sensible buying decision.
Use the nine-field comparison in real-world conditions to compare offers. It makes specific mechanical properties useful in real-world conditions, rather than turning an isolated number into a purchase decision.
| Field | Record explicitly | Comparison action |
|---|---|---|
| Alloy or grade | Full designation and governing specification | Separate different chemistries before ranking values. |
| Condition | Temper, heat treatment or cold-work state | Compare the same supplied condition. |
| Product form | Rod, bar, plate, casting or another form | Use data for the form being purchased. |
| Section and specimen geometry | Product dimensions and test specimen basis | Check sampling and geometric applicability. |
| Direction | Loading and sampling orientation | Align longitudinal, transverse or build-direction data. |
| Temperature | Actual test temperature and intended service temperature | Separate room-temperature and elevated-temperature results. |
| Test method | Edition, specimen, gauge length, loading procedure and compression strain criterion | Keep E8 4D and E8M 5D elongation bases distinct; align total strain for compression. |
| Modulus definition | Young’s, tangent or chord; tension or compression | Match the stress range and measurement basis. |
| Reporting basis | Typical, specified minimum or identified lot result | Compare the same kind of evidence. |
Consider two quotations for machined aluminum parts. One offer includes a typical 6061-T6 catalogue table; the other includes a test report for identified stock and an agreed material specification. The higher displayed strength number doesn’t determine the comparison, as the documents answer different questions. First, align the required grade, temper, form and acceptance limit. Then, ensure each offer provides the required evidence for that material. Last, take into account any machining, welding, or subsequent heat treatment that changes the delivered condition. A cheaper offer with the wrong temper is not equivalent stock, and a higher typical number is not a promise that every delivered part reaches it.
ASTM E8/E8M-25 normally defines room temperature as 10–38°C unless otherwise specified. Its public significance section also cautions that a sampled specimen need not represent the entire product or its in-service behavior. Record actual conditions instead of treating room temperature as an unstated universal constant.
Material selection for machined metal components

Material selection starts with the response that limits the component: elastic movement, permanent strain, cyclic damage or rapid fracture. Match that response to the relevant material property, then check geometry, environment and manufacturing condition. Geometry and these essential mechanical properties determine the component response. When selecting the material and process, use the relationship defined by the relevant property to decide rather than selecting the highest strength or hardness number in a catalog.
4-Load Property Selector
| Observed or expected loading | Start with | Carry into the comparison |
|---|---|---|
| Recoverable elastic movement | Modulus and component stiffness | Section geometry, length, supports and stress mode |
| Permanent set under a load | Yield or proof strength | Actual stress distribution and supplied condition |
| Repeated or fluctuating load | Fatigue response | Cycle history, stress ratio, surface and environment |
| Impact or an existing sharp flaw | Specified impact or fracture-toughness measure | Test type, temperature, specimen and crack conditions |
Add a time-and-temperature check if service conditions raise a creep concern.
Why study the mechanical properties of metals?
Understanding these characteristics allows you to choose a material based on how a component actually carries a load. For example, a thin cover needs sufficient stiffness to hold its shape, a formed part needs sufficient plastic strain capacity, and a rotating shaft needs cyclic-load resistance. Understanding these properties also helps determine if a material problem exists or if the problem lies with geometry or manufacturability.
Machining introduces another tradeoff. Metals with high hardness can be demanding to cut, while ductile materials can produce difficult chips in some operations. The machinability comparison adds that manufacturing perspective; hardness alone does not determine tool life or surface finish.
Key takeaway
Choose the property for the limiting response, then compare the same grade, condition and test basis.
For machining, combine the drawing and quantity with the material designation, condition requirements, and acceptance requirements. Zhenling’s material properties overview ties these inputs to machining discussions. Send this information through the contact page for material and machining review.
Frequently Asked Questions
What are the 8 properties of metals?
A useful eight-property mechanical list is strength, stiffness, elasticity, plasticity, ductility, malleability, hardness and toughness. There’s no compulsory list of exactly eight. Fatigue, creep and crack behavior add essential information for time-dependent or repeated loading. If the question includes physical properties, density and thermal conductivity may also appear, but they describe different responses from strength or ductility.
What are the 12 main types of mechanical properties of materials?
A practical twelve-entry list is yield strength, tensile strength, compressive strength, shear strength, stiffness, ductility, malleability, hardness, toughness, brittleness, fatigue resistance and creep resistance. Other lists group strength differently or list elasticity and plasticity separately. The useful distinction is what each property measures: elastic strain, permanent strain, localized indentation, cracking or behavior over time. Different lists don’t create different physical laws.
Is density a mechanical property of metals?
Density is normally a physical property: mass per unit volume. It doesn’t directly measure how a metal responds to loading. Density still matters when comparing component mass, specific strength or specific stiffness. Keep geometry and material condition in that comparison, because a lighter alloy with a lower modulus may need a different section to achieve the required stiffness.
Can hardness replace a tensile test?
No. Hardness measures localized indentation, while tensile testing measures a loading response that includes strength and ductility. A validated, material-specific hardness correlation can estimate strength within its range, but it doesn’t reproduce every tensile property or replace an agreed test requirement.
Why can the same metal grade have different mechanical properties?
The same grade can have different properties because condition, product form, section size, direction and testing basis also matter. Annealing, cold working, quenching, tempering or aging can change microstructure and therefore strength, hardness or ductility. A grade name alone doesn’t identify all of those details.
Before ranking values, align the temper, form, sampling orientation, test temperature and method. Subsequent welding or heat treatment can alter the final condition again. For a machining order, state both the material designation and the required supplied or finished condition alongside the drawing. That gives the material and manufacturing teams a common basis for the discussion.
References & Sources
- Penn State: Lesson 4, Mechanical Properties
- Mississippi State: Strength and Stiffness Characteristics
- ASTM E8/E8M-25: public tension-testing scope
- ASTM E9-19(2025)e1: public compression-testing scope
- ASTM E111-17(2025)e1: public modulus-testing scope
- ASTM E23-25: public notched-bar impact-testing scope
- ASTM E399-24: public plane-strain fracture-toughness scope
- ASTM E139-24: public creep and rupture-testing scope
- NIST: how Charpy impact measurement works
- University of Portland: fatigue teaching excerpt, Chapter 6
- University of Ljubljana ESDEP: engineering properties of steels
- Penn State: microstructure and elastic modulus, 2020 research exhibit
- NIST: tensile anisotropy in laser powder bed fusion metals, 2021 review
- The Fabricator: mechanical properties and forming behavior