


Attribute vs variable measurement data is a choice between recording a category or count and retaining a numerical value. In manufacturing quality control, attribute results include pass/fail, defect type, or defect count; variable results preserve a measured value such as diameter, runout, torque, or time.
The practical ruleChoose the result format that supports the next decision. Keep the numerical value when margin, target, trend, or variation matters; use a defined category or count when that output is valid and sufficient.
This guide treats data type as a feature-level planning decision. It does not prescribe a universal sample size, accept/reject rule, gage study, or control chart, and it does not claim a specific Zhenling accuracy, calibration scope, or laboratory accreditation.
Attribute vs Variable Measurement Data: The Short Answer
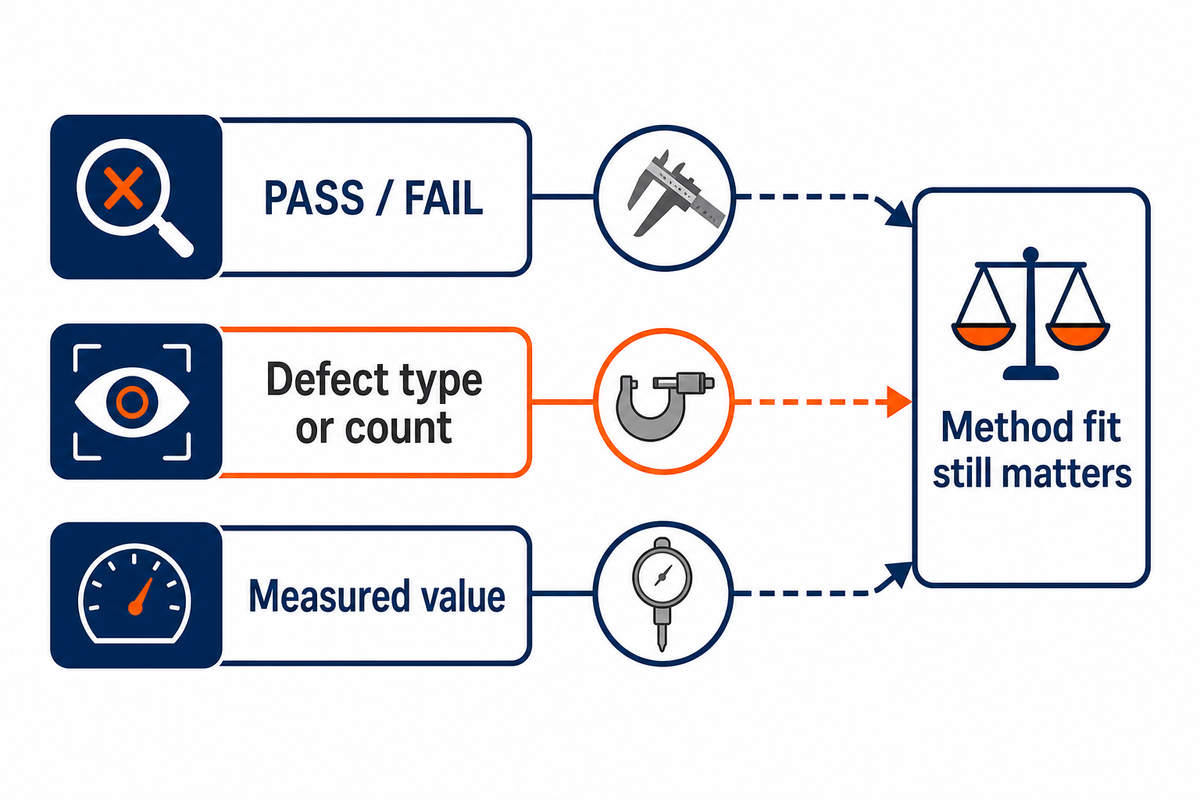
Attribute data tell you which category an observation belongs to or how many events occurred. Variable data tell you the observed numerical value on a continuous scale, preserving the distance from a target or specification limit.
| Question | Attribute output | Variable output |
|---|---|---|
| What is recorded? | PASS / FAIL | 19.99 mm |
| What is preserved? | The classification | The value and calculable margin |
| Typical use | Screening, presence, visual class, counts | Targeting, trending, variation, near-limit decisions |
ASQ describes attribute information and variable measurement data in this familiar quality-control sense. The official ASME Y14.45-2021 page confirms that the standard establishes uniform practices for reporting both attribute and variable data within its stated dimensioning-and-tolerancing scope.
Important metrology boundary
NIST notes that nominal and ordinal qualitative properties may themselves be measurands. “Attribute” is therefore not a synonym for “not measured”; the safe distinction is the form of the recorded result and the decision it supports.
NIST notes that nominal and ordinal qualitative properties may themselves be measurands. “Attribute” is therefore not a synonym for “not measured”; the safe distinction is the form of the recorded result and the decision it supports.
Attribute and Variable Data at a Glance
Variable data usually retain more information, but more information is useful only when the method is fit for the feature and the value changes an action. Attribute data intentionally compress the result, which can speed a valid screen while removing margin and distribution detail.
NIST’s attribute-control-chart guidance distinguishes classified units from counts of nonconformities; that distinction is one reason the data record must preserve what was actually observed.
| Characteristic | Possible attribute record | Possible variable record | Decision gained |
|---|---|---|---|
| Hole diameter | Pass / fail | Illustrative 25.00 mm diameter | Margin and centering |
| Thread fit | GO / NO-GO | Illustrative 24.98 mm pitch diameter | Functional screen or numerical analysis |
| Leak check | Pass at stated condition | Illustrative 50 PSI screen or leak rate | Threshold screen or quantified margin |
| Surface marks | Class or count in a defined zone | Length/depth if measurable and relevant | Appearance class or severity analysis |
| Runout | Pass / fail | Runout value | Conformance plus process signal |
| Surface roughness | Approved class | Illustrative 0.8 μm result | Severity and trend |
| Flatness | Pass / fail | Illustrative 0.05 mm result | Margin and process signal |
| Part mass | Within class | Illustrative 2.4 kg result | Actual value and drift |
| Conditioned check | Pass at stated condition | Illustrative 20 °C after 30 min | Result tied to test condition |
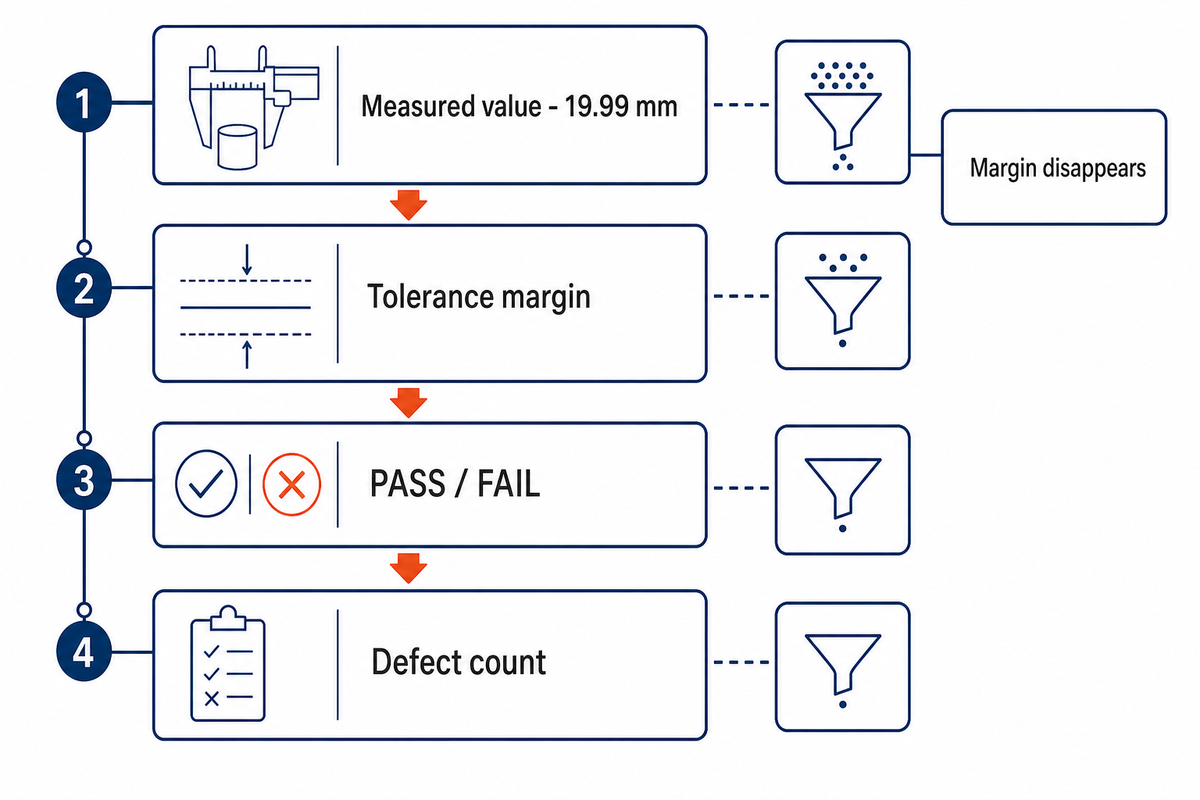
The 4-Level Information Loss Ladder
1. Measured value
19.99 mm
19.99 mm
2. Tolerance margin
Calculable only after limits and rule are known
Calculable only after limits and rule are known
3. PASS / FAIL
Category remains; margin disappears
Category remains; margin disappears
4. Defect count
Lot-level summary; feature value is gone
Lot-level summary; feature value is gone
The ladder does not say that every inspection should climb toward variable data. It shows what cannot be recovered after reduction, so the buyer can decide whether that information is worth the method, time, and reporting effort.
This labeled hypothetical makes the comparison concrete: a 25.00 mm target, a 24.98 mm result, a 0.02 mm difference, a 0.01 mm resolution, a test held at 20 °C, or a leak screen at 50 PSI for 2 hours aren’t interchangeable facts. A 30 min recording interval, a 5 s dwell, a 10 μm runout check, a 0.8 μm surface value, a 2 bar pressure stage, a 60 °F environmental note, and an uncertainty statement of ±0.005 mm likewise describe different parts of the evidence. Units, conditions, and the decision rule determine whether the value should remain numerical or be reduced to a category.
When Attribute Data Is Enough
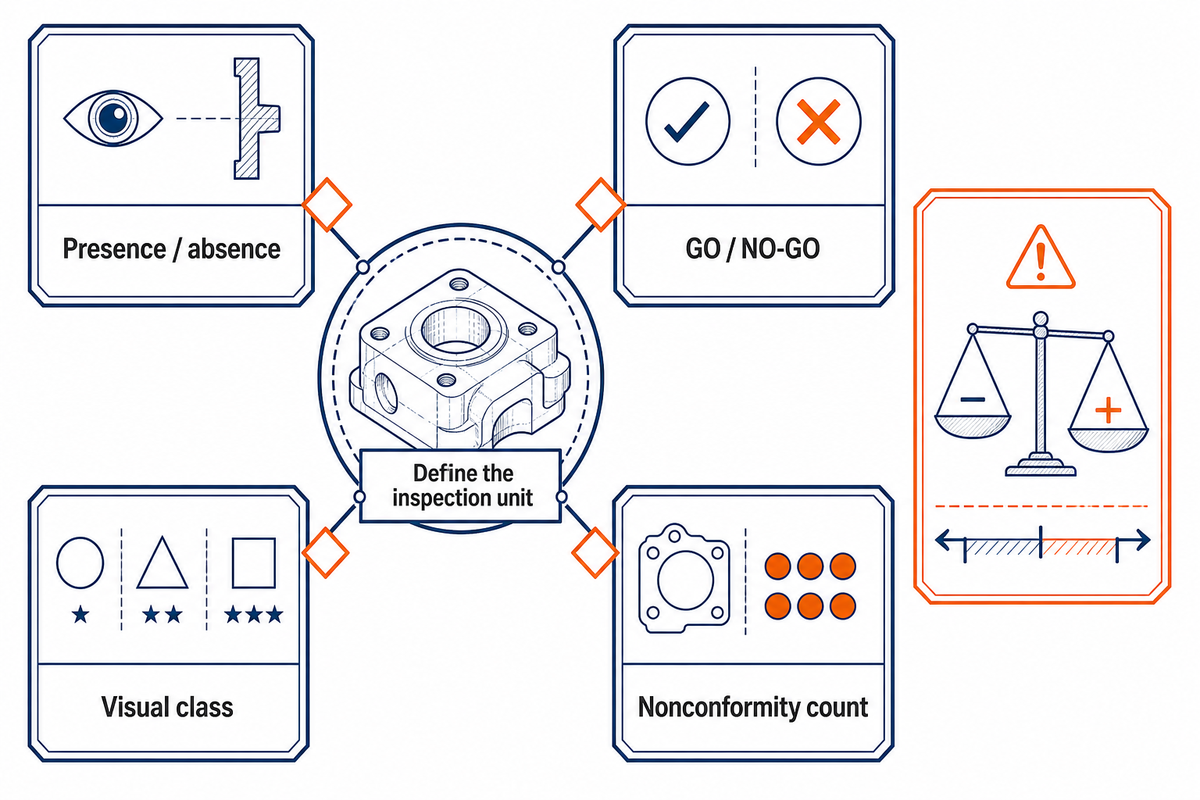
Attribute data are enough when the defined decision is genuinely categorical or count-based and a numerical margin would not change the action. Common cases include presence/absence checks, valid GO/NO-GO functional screens, visual classes, and nonconformity counts in a defined inspection unit.
A thread plug gage can answer a functional GO/NO-GO question without pretending to report pitch diameter. A label check can record present/absent, and a leak test can record pass/fail only when the medium, pressure, stabilization time, duration, threshold, and test setup are controlled.
What is an example of attribute data?
Visual inspectors may classify a surface as acceptable or unacceptable against a controlled reference, or count scratches inside a defined zone. The record is useful only if the criterion, zone, lighting or viewing conditions, part state, reference standard, and disposition authority are clear enough for repeatable application.
Visual inspectors may classify a surface as acceptable or unacceptable against a controlled reference, or count scratches inside a defined zone. The record is useful only if the criterion, zone, lighting or viewing conditions, part state, reference standard, and disposition authority are clear enough for repeatable application.
Categorical results are not statistically useless. Attribute agreement analysis can compare an appraiser with themselves, with other appraisers, and with a known standard; Minitab documents binary, nominal, and ordinal examples, though its software workflow isn’t a universal standard.
Define the unit before choosing a chart or summary. Nonconforming parts are not the same as the number of nonconformities on those parts, and NIST separates these structures because they lead to different models and denominators.
Sampling boundary
A pass decision on a sample does not prove that every unmeasured unit conforms. Producer risk, consumer risk, sample design, switching rules, and the definition of an inspection unit belong to the approved plan.
A pass decision on a sample does not prove that every unmeasured unit conforms. Producer risk, consumer risk, sample design, switching rules, and the definition of an inspection unit belong to the approved plan.
When Variable Data Earns Its Cost
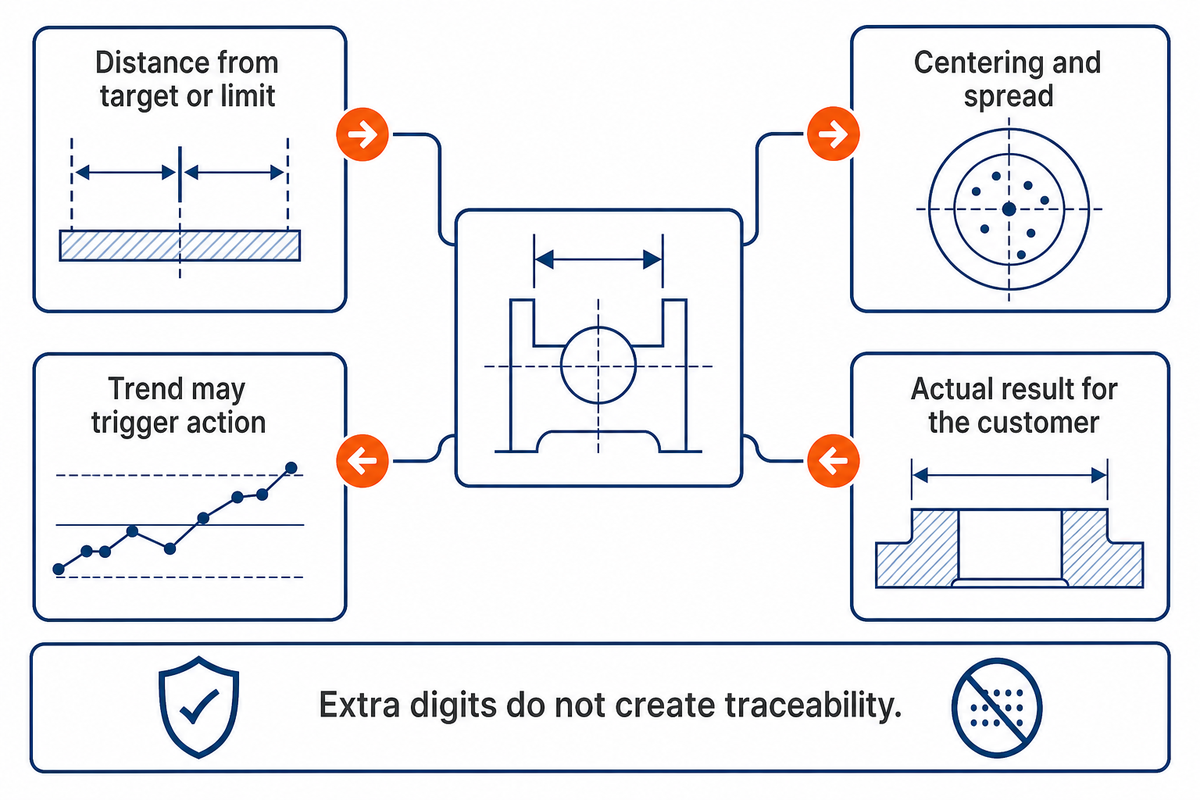
Variable data earn their cost when the numerical value changes the decision: distance from a target or limit matters, process centering or spread must be evaluated, a trend may trigger action, or a buyer needs the actual result rather than a classification. The prior attribute screen cannot recover that lost margin.
Even a stable numerical method must still be feasible for the feature, datum setup, surface condition, material state, and production environment. Reporting extra digits does not create resolution, traceability, or a valid uncertainty statement.
What is a variable measurement?
A variable measurement produces a value on a numerical scale, such as 19.99 mm, 0.04 mm runout, 8.2 N·m torque, or a measured leak rate. Its usefulness depends on units, method, resolution, setup, part state, calibration or traceability basis, and the decision attached to the result.
Worked example: 20.00 mm featureSuppose a report records 19.99 mm. The value preserves more information than PASS, but conformity still depends on the drawing limits, the measurement uncertainty where applicable, and the agreed decision rule. Without those inputs, the arithmetic margin isn’t an acceptance verdict.
ISO 14253-1:2017 establishes GPS decision rules for conformity and nonconformity while accounting for uncertainty near specification limits. Its scope does not automatically extend to every functional, destructive, visual, or leak test.
Variable acceptance sampling also has assumptions. ISO 3951-1:2022 describes single sampling plans for a continuing series of lots, one continuous characteristic, statistical control, and a normal or close-to-normal distribution; outside those conditions, “variable is better” is not a valid shortcut.
Seven Rules for Choosing by Feature, Risk and Decision
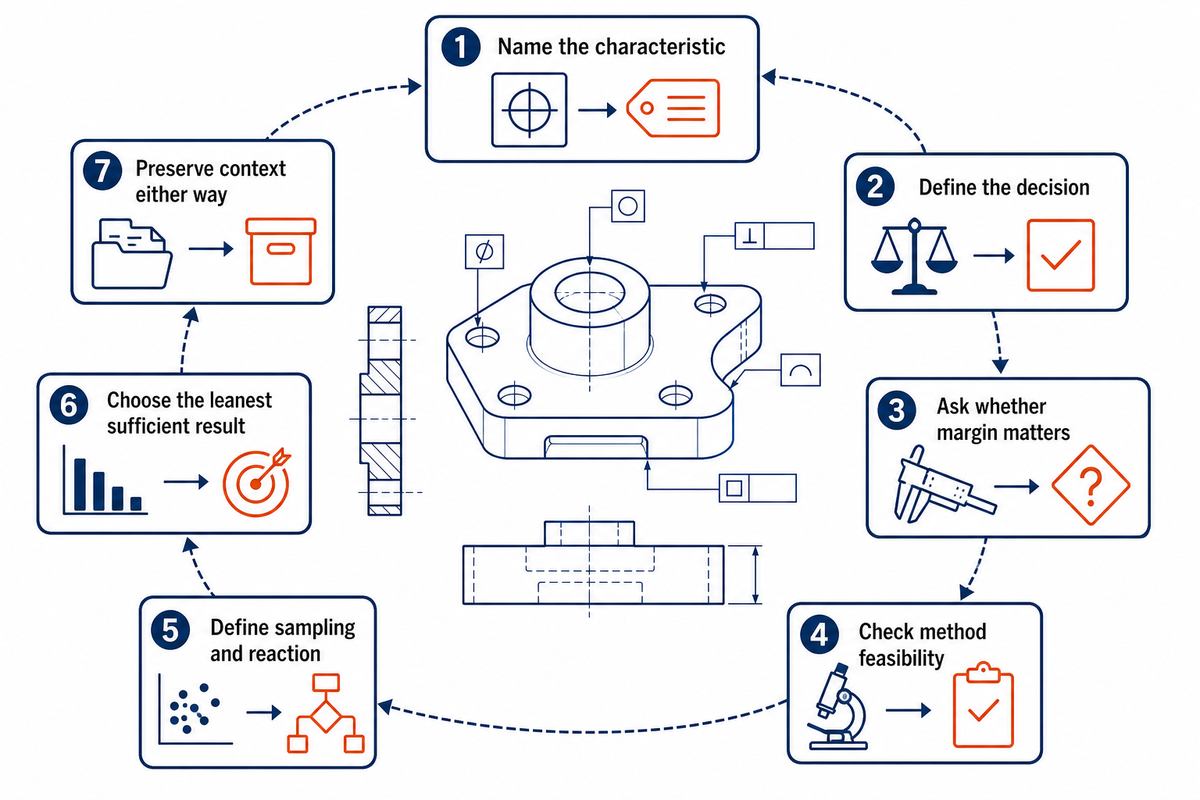
Do not label an entire drawing “attribute” or “variable” before examining its characteristics. Use the Feature-to-Data Route Card for each feature, then combine the routes into one inspection plan.
The 7-Rule Feature-to-Data Framework
- Name the characteristic. State the feature, datum reference, units, category, or inspection unit.
- Define the decision. Is this lot disposition, process adjustment, gage evaluation, functional screening, or information for a customer record?
- Ask whether margin matters. If distance from target or limit changes action, preserve the value.
- Check method feasibility. Confirm the numerical method is stable for the geometry, part state, access, surface, and environment.
- Define sampling and reaction. Name the unit, opportunity, frequency, escalation, and authority without inventing universal numbers.
- Choose the leanest sufficient result. Use variable data when value and margin matter; use attribute data when a valid category or count is enough.
- Preserve context either way. Record method, conditions, sampling, units or categories, and the decision rule.
| Scenario | Data type / route | Why |
|---|---|---|
| Fit-critical dimension during process development | Variable | Centering, margin, and variation can change action |
| Validated high-volume GO/NO-GO screen | Attribute | Functional category may be sufficient for the stated reaction |
| Visual defect in a controlled zone | Attribute class or count | Criterion is categorical unless severity is measured validly |
| Destructive test | Decision-specific | Preserve a value only if it changes inference or disposition |
| Incoming inspection | Mixed | Critical dimensions and categorical checks can coexist |
| Coating present in a masked zone | Attribute | Presence may be the complete contractual question |
| Fastener torque trace | Variable | The value and sequence may support the reaction |
| Surface roughness characteristic | Variable or defined comparator class | Route depends on the drawing and valid method |
| Nonconformities per inspected area | Attribute count | Opportunity or exposure must remain explicit |
Three checks prevent the route card from becoming a mechanical checkbox. First, ask whether the result will release a lot, adjust a process, validate a measurement system, or document a characteristic for the customer; those are different decisions. Second, decide whether the feature can be measured numerically without creating a method problem that is larger than the information gained.
Third, define what happens after an exception. PASS/FAIL screens without escalation may hide a drifting process, while a page of values without a reaction limit may create data that nobody can act on. The route is complete only when the result, reviewer, and next action are named together.
Use Zhenling’s inspection method selector as a planning aid, then confirm the order-specific method and report with the responsible parties.
What Each Data Type Can and Cannot Prove
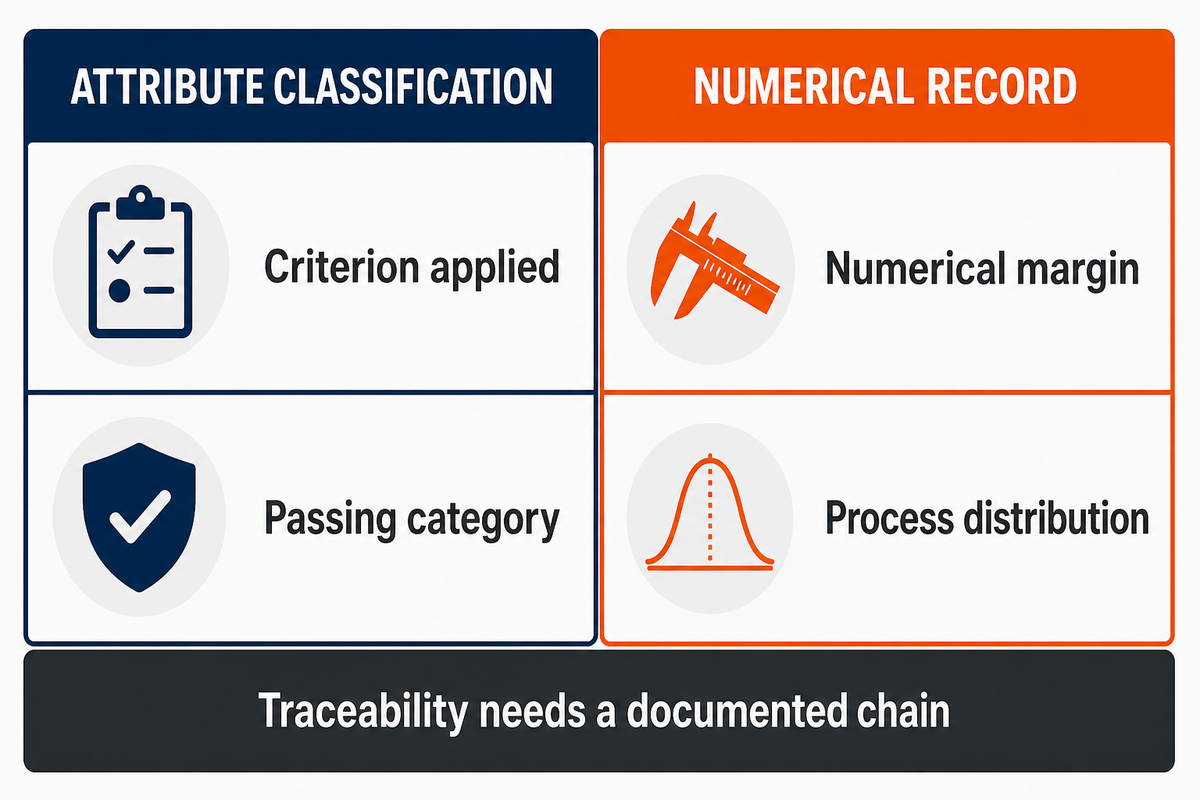
When the method and record are valid, a PASS classification can prove that the stated criterion was applied and the observed item was placed in the passing category. It cannot reveal the original numerical margin, process distribution, or the condition of uninspected units.
A numerical value can preserve margin and support trend or variation analysis. It does not by itself prove traceability, method fitness, process capability, or conformity under an unstated decision rule.
Traceability belongs to the result
NIST’s traceability guidance requires a documented chain to specified references and evidence that lets the user assess the claim. A CMM photograph, instrument brand, or calibration sticker alone is not the result’s traceability record.
NIST’s traceability guidance requires a documented chain to specified references and evidence that lets the user assess the claim. A CMM photograph, instrument brand, or calibration sticker alone is not the result’s traceability record.
Specification conformity is also different from functional fitness. NIST notes that a part can be nonconforming to an engineering specification and still function, while an in-spec part can fail its intended function; the drawing decision and functional decision must therefore be named separately.
The tolerance limit calculator can help organize arithmetic limits and margin. It is neither an uncertainty evaluation, a contractual decision rule nor an acceptance authority.
Match the Data to MSA and Process Control
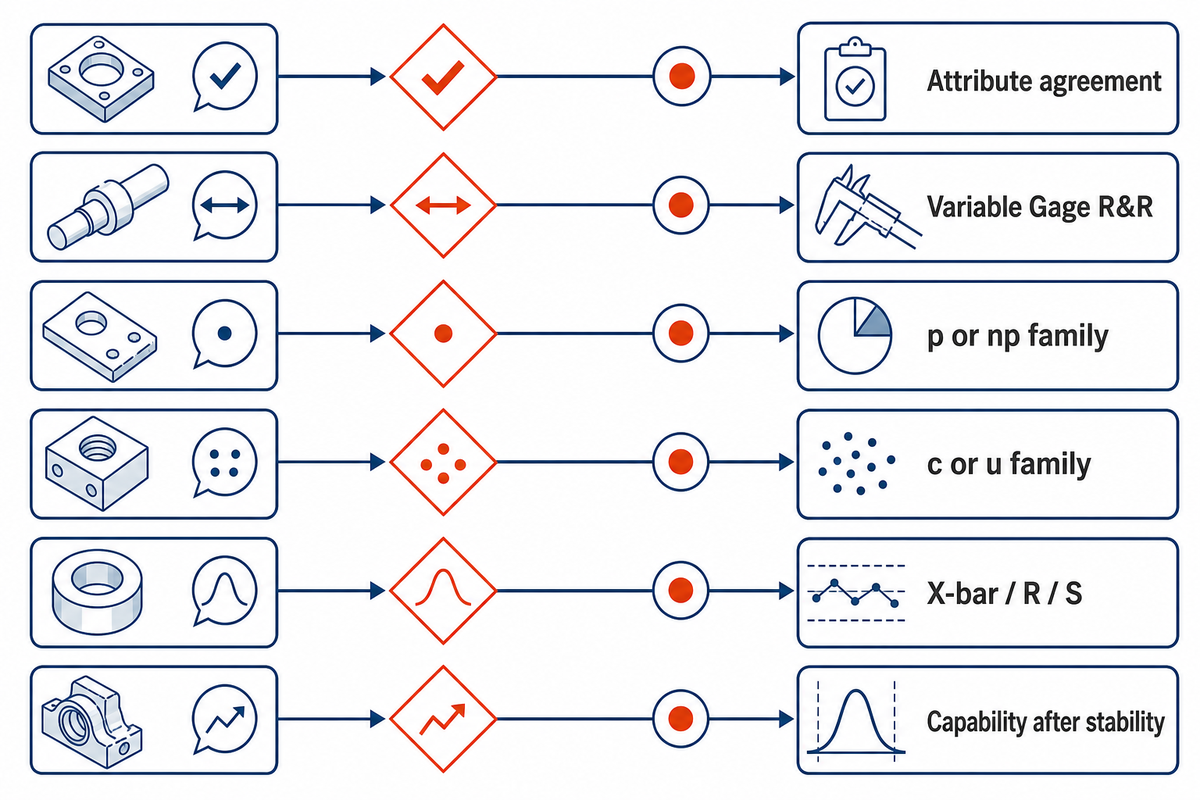
Attribute and variable data do not share one automatic MSA or control-chart route. Attribute agreement addresses categorical ratings, variable Gage R&R addresses results on a continuous scale, and control-chart choice depends on what is counted or measured, the denominator or opportunity, subgrouping, and data dependence.
The difference between variable and attribute data changes both data collection and statistical analysis. In an attribute vs variable data review, discrete outcomes may route to p-charts or np-charts for units and c-charts or u-charts for counts, while numerical results can expose measurement error, standard deviation, and process performance.
Pareto charts can prioritize categories, but the measuring instrument, study design, SPC method, and statistical power still govern interpretation. In Six Sigma and SPC usage, variable and attribute data are each a type of data matched to a different question.
Six Sigma and broader quality literature often describe these as variable and attribute data: two types of data that route to different measurement system analysis and statistical process control questions. In SPC, the control chart must match the statistic and sampling structure; a Cpk calculation is not a substitute for establishing stability, suitable measurement, and the assumptions behind the capability model.
| Question | Typical route | Boundary to verify |
|---|---|---|
| Do appraisers classify consistently? | Attribute agreement | Standard, repeats, category prevalence, disagreement pattern |
| How much variation comes from a numerical system? | Variable Gage R&R or appropriate study | Study design, part variation, operator/method structure |
| What fraction of units is nonconforming? | p or np family | Sample size and binomial assumptions |
| How many nonconformities occur? | c or u family | Constant or varying opportunity/exposure |
| How does a continuous process vary? | X-bar/R/S or another justified route | Rational subgrouping, stability, distribution, autocorrelation |
| Is the process capable? | Capability analysis after stability | Specification meaning and model assumptions |
What is the difference between attribute and variable gauges?
An attribute gage returns or supports a category such as GO/NO-GO, acceptable/unacceptable, or a defined class. Variable gages return numerical values, but the hardware label does not settle whether the study, resolution, setup, or uncertainty is suitable for the decision.
Do not collapse defects and defectives into one bucket. NIST’s chart guidance distinguishes nonconforming units from individual nonconformities, while p/np and c/u choices also depend on sample size or inspection opportunity.
Agreement statistics need context too. A PubMed-indexed methods study shows how high observed agreement can coexist with a low kappa and how prevalence and marginal patterns affect interpretation.
Time-order warning
Data type does not eliminate dependence. NIST uses autocorrelation to detect non-randomness; when observations depend on earlier observations, a time-series model may be needed instead of a standard independent-data control route.
Data type does not eliminate dependence. NIST uses autocorrelation to detect non-randomness; when observations depend on earlier observations, a time-series model may be needed instead of a standard independent-data control route.
Build a Supplier Inspection Record Buyers Can Audit
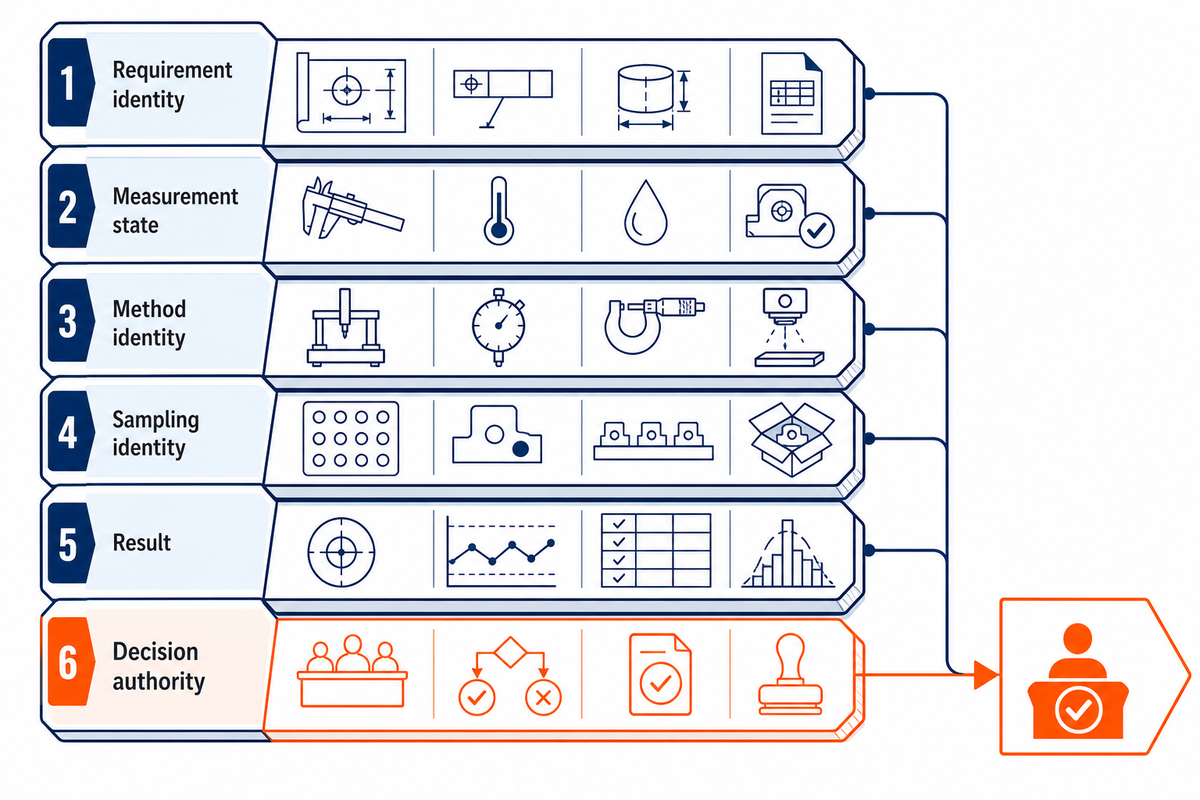
Spreadsheets of numbers or PASS labels are not self-explanatory. Buyers need enough context to connect every result to the order, feature, method, sample, and acceptance authority.
The Acceptance Evidence Stack
1. Requirement identity
Order, drawing, revision, feature, characteristic
Order, drawing, revision, feature, characteristic
2. Measurement state
Datum, support, part condition, environment
Datum, support, part condition, environment
3. Method identity
Method, equipment ID, units, resolution
Method, equipment ID, units, resolution
4. Sampling identity
Unit, quantity, location, frequency, opportunity
Unit, quantity, location, frequency, opportunity
5. Result
Value, category, count, and any required uncertainty
Value, category, count, and any required uncertainty
6. Decision authority
Rule, disposition, approver, traceability basis
Rule, disposition, approver, traceability basis
The stack also makes disagreements diagnosable. If a supplier and buyer reach different conclusions, they can compare the same drawing revision, feature identity, datum state, method, sample, result, and rule instead of debating an isolated spreadsheet cell.
Keep contractual and analytical records distinct where needed. A certificate or calibration reference can support the evidence chain, but it does not replace the feature result; likewise, a result does not state who had authority to accept a deviation. The report should make those layers visible without implying that every job requires the same form.
ASME Y14.45 supports a consistent reporting context for attribute and variable measurement data within its scope. NIST’s conformity work explains why uncertainty and decision rules can affect acceptance risk, so the stack keeps “result” and “decision” as separate layers.
“related to a reference through a documented unbroken chain of calibrations, each contributing to the measurement uncertainty.”
Use the inspection scope builder to expose missing handoff fields, and the dimensional inspection method selector to organize a feature-level discussion. Neither tool replaces the drawing, contract, applicable standard, or authorized disposition.
Bring the feature list before requesting a report
Share the drawing revision, critical characteristics, intended data type, sampling need, and required report fields. Zhenling can review an order-specific inspection and reporting scope without turning a generic article into an acceptance plan.
Use Both Data Types in One Inspection Plan
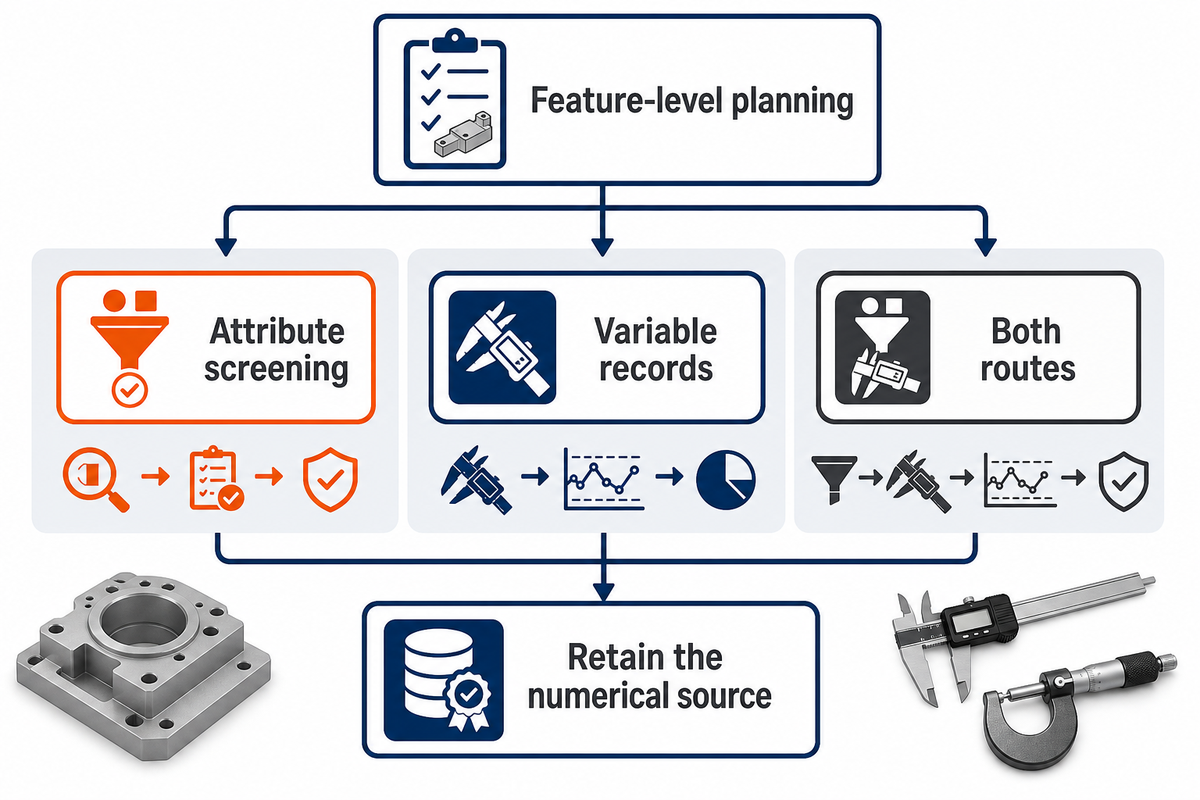
Drawings and lots do not need one data type for every characteristic. First-article inspection may retain numerical values for decision-sensitive dimensions while production screening uses validated attribute checks for presence, fit, appearance, or other valid categorical characteristics.
The switch must have a reason and reaction plan. For example, a defined exception during production screening may trigger measured follow-up, while trend-sensitive features continue to retain values under the approved plan.
Mixed plans may also change across phases without changing the feature’s requirement. Development can retain values to learn about variation, first-article inspection can document the agreed characteristics, and production can use the validated screen or measurement route named in the control plan. Any transition needs approval and evidence; volume alone does not justify throwing values away.
Mixed does not mean inconsistent
Consistency comes from tying each feature to one decision, method, data type, sampling rule, and escalation path. Such a plan becomes confusing only when those links are missing.
Consistency comes from tying each feature to one decision, method, data type, sampling rule, and escalation path. Such a plan becomes confusing only when those links are missing.
This is a planning pattern, not Zhenling’s default procedure and not a universal first-article-to-production switching rule. For order-specific method and report planning, use the CNC metrology page as the commercial handoff.
Shanghai Zhenling Hardware Co., Ltd. was established in 2006 and manufactures made-to-print non-standard metal components in Jiashan, Zhejiang. That company background explains the manufacturing context; it does not establish a particular instrument accuracy, uncertainty, accreditation, sampling plan, or acceptance result.
Frequently Asked Questions
What is the difference between attribute data and variable data?
Attribute data record a category or count, while variable data record a numerical value and preserve distance from a target or limit in the process.
Attribute results can answer pass/fail, present/absent, class, nonconforming-unit, or nonconformity-count questions. Variable results preserve the observed value and therefore support margin, centering, trend, and variation analysis when the method and assumptions are valid. For the same feature, a 25.01 mm reading contains more decision information than a simple pass because it shows the observed location within the allowed range.
What is the difference between attribute and variable gauges?
An attribute gage supports a category such as GO/NO-GO; a variable gage returns a numerical value with units that can show margin and variation over time.
The label does not prove suitability. Confirm the feature, datum setup, resolution, method, part condition, agreement or variation study, and reaction rule before relying on either result. A functional plug gage can be efficient for a defined screen, whereas a calibrated numerical method may be needed when engineering must understand margin, drift, or process variation.
What is a variable measurement?
A variable measurement is a numerical observation such as diameter, runout, torque, time, or leak rate taken under a defined method, setup, and unit for a decision.
Its meaning depends on units, method, setup, traceability basis, relevant uncertainty, and the decision rule. More digits do not automatically create more trustworthy information. The reported number should remain linked to the feature definition and measurement conditions so another qualified reviewer can interpret how the record supports the acceptance decision.
Are attributes the same as variables?
No.
In quality-control usage, attributes are categorical or count outcomes, while variables retain continuous numerical values. Some nominal or ordinal qualitative properties can still be measurands in a broader metrology context.
When is attribute data the right choice?
Attribute data are right when a defined category or count is valid, repeatable, and sufficient for the intended decision without losing evidence needed for later action.
Use them for justified presence checks, GO/NO-GO screens, visual classes, or counts with a defined inspection unit. Confirm that the category boundary, reference standard, sampling unit, inspection opportunity, appraiser training, and escalation path are explicit. Also separate a count of nonconforming units from a count of nonconformities because those questions route to different analyses. Preserve variable data when margin, target, trend, process variation, or near-limit interpretation changes the action, and do not discard the numerical source merely because a dashboard needs a pass/fail summary.
References & Sources
- Attribute & Variable Data Tutorial ASQ
- Attribute & Variable Sampling ASQ
- Y14.45-2021 Measurement Data Reporting ASME
- ISO 14253-1:2017 ISO
- ISO 3951-1:2022 ISO
- Metrological Traceability FAQ and NIST Policy NIST
- Assessment of Conformity, Decision Rules and Risk Analysis NIST
- What Are Attributes Control Charts? NIST/SEMATECH
- Autocorrelation NIST/SEMATECH
- Behavior and Interpretation of the Kappa Statistic PubMed-indexed journal article
Sources accessed September 29, 2026. Standards pages identify public scope and edition status; purchase or adoption requirements remain project-specific.